
TMA Centered MACD OBV Indicator V2.0 MT4: The Ultimate Guide to Enhanced Trading Analysis
Technical analysis forms the backbone of modern trading strategies, enabling traders to make informed decisions based on historical price data and market patterns. Among the multitude of indicators available to traders, the TMA (Triangular Moving Average) centered MACD (Moving Average Convergence Divergence) with OBV (On-Balance Volume) Indicator V2.0 for MT4 stands out as a powerful combination that offers comprehensive market insights.
This advanced indicator merges three powerful technical analysis tools into one cohesive system, providing traders with a multi-faceted approach to market analysis. In this comprehensive guide, we'll explore every aspect of this indicator, from its fundamental components to practical trading applications, helping you harness its full potential in your trading journey.
Understanding the Core Components
Triangular Moving Average (TMA)
The Triangular Moving Average is a type of weighted moving average that places more emphasis on the middle portion of the data series. Unlike simple moving averages that give equal weight to all data points, TMA applies a triangular weighting scheme, resulting in a smoother line that's less responsive to recent price fluctuations but more effective at identifying the underlying trend.
The mathematical formula for TMA involves calculating a simple moving average of another simple moving average, effectively applying a double smoothing process. This characteristic makes TMA particularly useful for filtering out market noise and identifying the primary trend direction.
Moving Average Convergence Divergence (MACD)
Developed by Gerald Appel in the late 1970s, MACD is one of the most popular momentum indicators in trading. It consists of three components:
- The MACD line: The difference between a 12-period and 26-period exponential moving average (EMA)
- The signal line: A 9-period EMA of the MACD line
- The histogram: The difference between the MACD line and the signal line
The traditional MACD oscillates around a zero line, with crossovers between the MACD line and signal line generating trading signals. When the MACD line crosses above the signal line, it's considered a bullish signal, while a cross below indicates bearish momentum.
On-Balance Volume (OBV)
OBV is a volume-based indicator that uses changes in volume flow to predict price changes. Developed by Joe Granville, OBV operates on the principle that volume precedes price. The indicator adds volume on up days and subtracts volume on down days, creating a cumulative line that can help confirm price trends or identify potential reversals.
The logic behind OBV is straightforward: rising OBV indicates accumulation (buying pressure), while falling OBV indicates distribution (selling pressure). Divergences between OBV and price often precede significant price reversals.
The Synergy: TMA Centered MACD with OBV
The TMA centered MACD OBV Indicator V2.0 combines these three powerful tools into a single, cohesive system. The "centered" aspect of the MACD component refers to its placement relative to the TMA, creating a more balanced and accurate representation of market momentum.
This combination offers several advantages:
- Enhanced trend identification through TMA's smoothing effect
- Momentum confirmation through MACD's oscillation
- Volume validation through OBV's accumulation/distribution analysis
When used together, these indicators provide a more comprehensive view of market conditions than any single indicator could offer, helping traders filter out false signals and identify high-probability trading opportunities.
Installation and Setup Guide
Installing the TMA centered MACD OBV Indicator V2.0 on your MT4 platform is a straightforward process:
- Download the indicator file (typically a .ex4 or .mq4 file)
- Open your MT4 platform
- Navigate to "File" > "Open Data Folder"
- In the new window, open the "MQL4" folder
- Within MQL4, open the "Indicators" folder
- Copy the indicator file into the Indicators folder
- Restart your MT4 platform or refresh the indicators list
- The indicator should now appear in the "Navigator" window under "Indicators"
- Drag and drop the indicator onto your desired chart
Once installed, you can customize the indicator parameters by right-clicking on the chart, selecting "Indicators list," choosing the TMA centered MACD OBV Indicator, and clicking "Edit." The default parameters are typically optimized for most trading scenarios, but you may adjust them based on your specific trading style and timeframe.
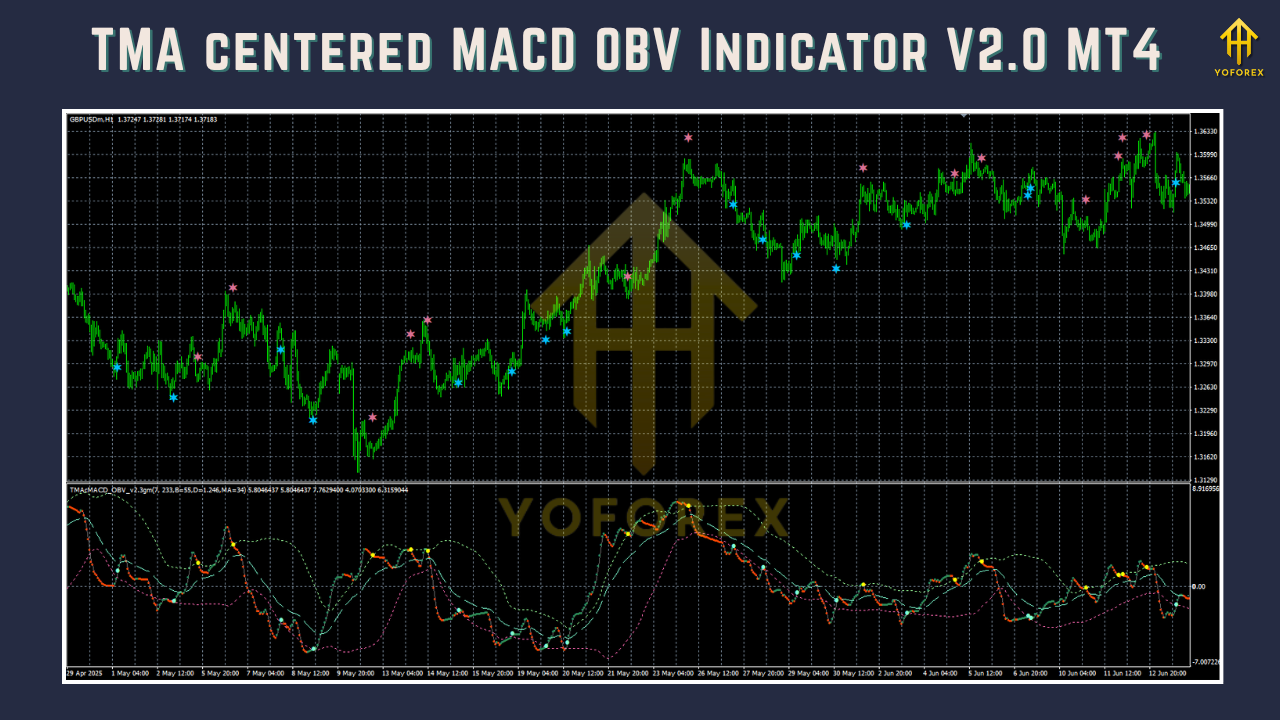
Interpreting the Indicator Signals
The TMA centered MACD OBV Indicator V2.0 generates several types of signals that traders can use to inform their decisions:
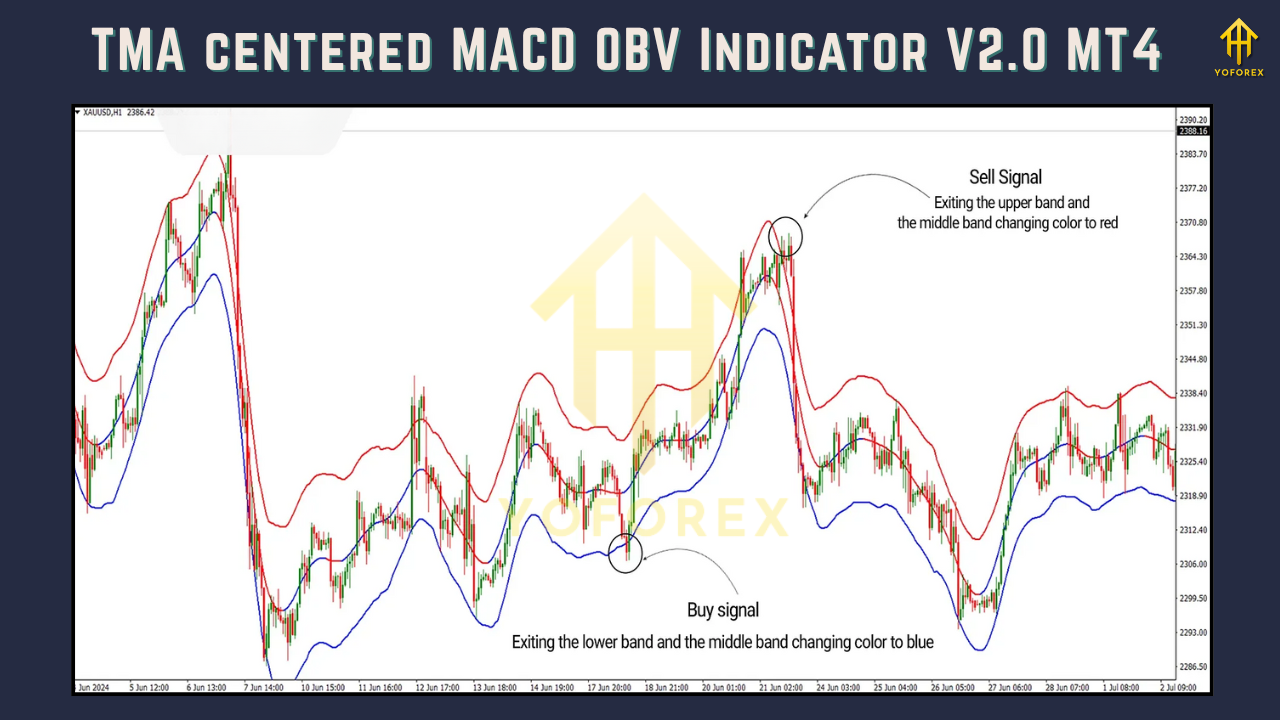
TMA-Based Signals
The TMA component provides the primary trend direction:
- When price is consistently above the TMA, the market is in an uptrend
- When price is consistently below the TMA, the market is in a downtrend
- When price crosses above the TMA, it may signal the start of a new uptrend
- When price crosses below the TMA, it may signal the start of a new downtrend
MACD-Based Signals
The MACD component provides momentum information:
- Bullish crossover: MACD line crosses above the signal line
- Bearish crossover: MACD line crosses below the signal line
- Centerline crossover: MACD crosses above zero (bullish) or below zero (bearish)
- Divergence: When MACD moves in the opposite direction of price
OBV-Based Signals
The OBV component validates price movements with volume:
- Rising OBV with rising prices confirms bullish strength
- Falling OBV with falling prices confirms bearish strength
- OBV divergence from price may signal an impending reversal
- Sudden spikes in OBV may indicate significant accumulation or distribution
Combined Signals
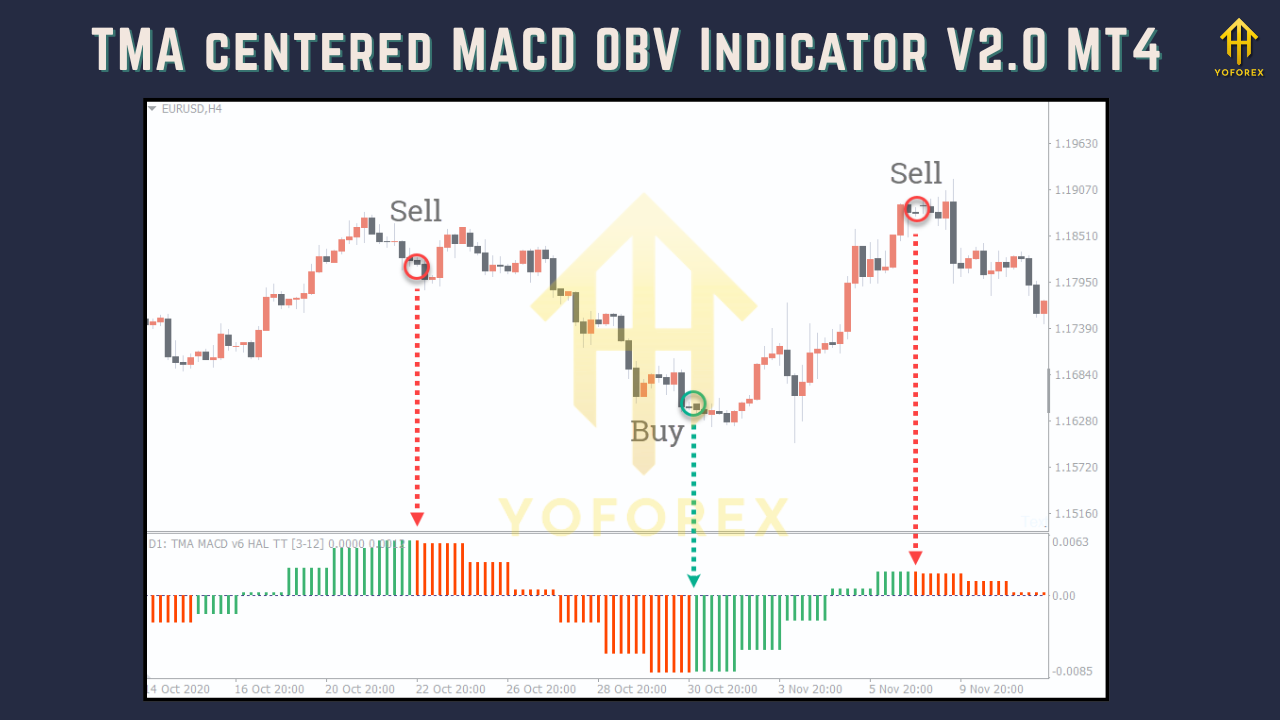
The true power of this indicator lies in the convergence of signals from all three components:
- A buy signal is generated when price is above TMA, MACD shows bullish crossover, and OBV is rising
- A sell signal is generated when price is below TMA, MACD shows bearish crossover, and OBV is falling
- Confirmation signals occur when all three components align in the same direction
- Warning signals arise when components diverge, suggesting potential market reversal
Practical Trading Applications
Trend Following Strategy
The TMA centered MACD OBV Indicator V2.0 excels in trend-following scenarios:
- Identify the primary trend using the TMA component
- Wait for pullbacks toward the TMA in the direction of the primary trend
- Look for MACD bullish crossovers during uptrends or bearish crossovers during downtrends
- Confirm with OBV moving in the direction of the primary trend
- Enter trades when all three components align
- Set stop-loss below recent swing lows (for long positions) or above recent swing highs (for short positions)
- Take profit when price shows signs of exhaustion or reversal
Reversal Trading Strategy
The indicator can also identify potential trend reversals:
- Look for price divergence from TMA (price making new highs while TMA fails to confirm)
- Watch for MACD divergence (price making new highs/lows while MACD fails to confirm)
- Monitor OBV divergence (price moving in one direction while OBV moves in the opposite)
- Enter trades when all three components show reversal signals
- Use tighter stop-losses for reversal trades as they carry higher risk
- Take profit quickly when the initial reversal momentum exhausts
Breakout Trading Strategy
The indicator can help confirm breakouts from key levels:
- Identify consolidation areas where price is compressed around the TMA
- Wait for a decisive price breakout above resistance or below support
- Confirm with MACD showing strong momentum in the breakout direction
- Validate with OBV showing increased volume in the breakout direction
- Enter trades when all three components support the breakout
- Set stop-loss just outside the consolidation area
- Take profit when the breakout shows signs of exhaustion
Timeframe Considerations
The TMA centered MACD OBV Indicator V2.0 can be applied across different timeframes, with each timeframe providing different insights:
Higher Timeframes (Daily, Weekly, Monthly)
Higher timeframes provide the most reliable signals as they filter out short-term market noise:
- Use for identifying primary trends and major support/resistance levels
- Ideal for position traders and investors
- Signals occur less frequently but have higher reliability
- Best for setting the overall market context for shorter-term trades
Lower Timeframes (1-hour, 4-hour)
Lower timeframes are suitable for swing and day traders:
- Provide more frequent trading opportunities
- Useful for identifying entry and exit points within the primary trend
- Require more careful filtering to avoid false signals
- Best for traders who can monitor markets more frequently
Multi-Timeframe Analysis
For optimal results, consider using a multi-timeframe approach:
- Use higher timeframes to identify the primary trend and major support/resistance
- Use lower timeframes to find precise entry and exit points
- Ensure signals align across multiple timeframes for higher probability trades
- Use the indicator consistently across all timeframes for a cohesive trading strategy
Risk Management Considerations
No indicator provides perfect signals, and the TMA centered MACD OBV Indicator V2.0 is no exception. Proper risk management is essential for long-term trading success:
Position Sizing
Determine appropriate position sizes based on:
- Account size and risk tolerance
- Stop-loss distance
- Volatility of the trading instrument
- Overall market conditions
Stop-Loss Placement
Use the indicator to help place logical stop-loss levels:
- For trend-following trades, place stops below TMA in uptrends or above TMA in downtrends
- For reversal trades, place stops beyond the recent swing point
- Consider volatility-based stops for highly volatile markets
Take-Profit Targets
Set realistic profit targets based on:
- Previous support/resistance levels
- Fibonacci retracements or extensions
- Risk-reward ratio (typically aiming for at least 1:2 or 1:3)
- Market structure and potential reversal zones
Trade Filtering
Not all signals are equal. Filter trades based on:
- Overall market context (trend direction)
- Confirmation from multiple timeframes
- Volume confirmation through OBV
- Risk-reward ratio before entry
Common Pitfalls and How to Avoid Them
Over-Reliance on the Indicator
While the TMA centered MACD OBV Indicator V2.0 is powerful, relying solely on any indicator can lead to poor trading decisions:
- Combine price action analysis with indicator signals
- Consider fundamental factors that may influence market direction
- Use the indicator as part of a comprehensive trading system, not in isolation
Ignoring Market Context
Failing to consider the broader market context can lead to misinterpretation of signals:
- Always assess the higher timeframe trend before entering trades
- Be aware of major economic events and news releases
- Consider overall market sentiment and positioning
Poor Risk Management
Even the best trading strategy can fail without proper risk management:
- Never risk more than 1-2% of your trading account on a single trade
- Always use stop-loss orders to limit potential losses
- Adjust position sizes based on account size and volatility
Chasing the Market
Reacting emotionally to market movements often leads to poor decisions:
- Wait for high-quality setups that meet your criteria
- Avoid entering trades based on FOMO (fear of missing out)
- Stick to your trading plan and avoid impulsive decisions
Advanced Customization Options
The TMA centered MACD OBV Indicator V2.0 offers several customization options to suit different trading styles:
Parameter Optimization
Consider adjusting the default parameters based on:
- Your trading timeframe and style
- The volatility characteristics of your trading instruments
- Your personal risk tolerance
Visual Customization
Customize the indicator's appearance for better visibility:
- Adjust colors for different components (TMA, MACD lines, histogram, OBV)
- Modify line thickness for better visibility
- Adjust indicator placement on the chart for optimal viewing
Alert Settings
Set up alerts for important signals:
- TMA crossovers
- MACD crossovers
- OBV divergences
- Combined signal alignments
Backtesting and Strategy Validation
Before implementing any trading strategy based on the TMA centered MACD OBV Indicator V2.0, it's essential to conduct thorough backtesting:
Historical Data Testing
Test the indicator on historical price data to:
- Identify optimal parameters for your trading style
- Assess the win rate and risk-reward ratio
- Understand performance across different market conditions
Walk-Forward Analysis
Conduct walk-forward analysis to:
- Test the indicator's robustness across different time periods
- Avoid curve-fitting to historical data
- Validate the strategy's effectiveness in real-world conditions
Out-of-Sample Testing
Test the indicator on data not used during optimization:
- Ensure the strategy performs well on unseen data
- Confirm the strategy's generalizability
- Avoid over-optimization that leads to poor real-world performance
Conclusion: Maximizing Your Trading Potential
The TMA centered MACD OBV Indicator V2.0 for MT4 represents a powerful tool for traders seeking comprehensive market analysis. By combining trend identification (TMA), momentum analysis (MACD), and volume validation (OBV), this indicator provides a multi-dimensional view of market conditions that can significantly enhance trading decisions.
However, like any technical tool, its effectiveness depends on proper understanding, implementation, and integration into a comprehensive trading system. By following the guidelines outlined in this guide, you can harness the full potential of this indicator and elevate your trading to new heights.
Remember that successful trading requires not just the right tools but also discipline, patience, and proper risk management. The TMA centered MACD OBV Indicator V2.0 can be a valuable addition to your trading arsenal, but its true power is realized when used as part of a well-rounded approach to market analysis.
As you continue to explore and master this indicator, you'll discover nuances and applications specific to your trading style and preferences. The journey to trading mastery is ongoing, and tools like the TMA centered MACD OBV Indicator V2.0 can serve as valuable companions along the way.
Support & Disclaimer
Got questions or need help? Reach out anytime:
- WhatsApp: https://wa.me/+443300272265
- Telegram: https://t.me/yoforexrobot
Disclaimer: Past performance is no guarantee of future results. All trading carries risk. Always demo-test the TMA centered MACD OBV Indicator V2.0 MT4 in a risk-free environment before deploying on a live account.


Comments
No comments yet. Be the first to comment!
Leave a Comment