
This post delves into the NLGMA ATR Indicator V5.85 for MetaTrader 4, explaining what ATR is, how this custom version enhances volatility analysis, step-by-step installation, recommended settings, practical trading strategies, risk management techniques, and limitations. You’ll learn to leverage the indicator’s advanced features—such as dynamic ATR channels, colored volatility zones, and customizable alerts—to optimize trade entries, set precise stop losses, and size positions according to market conditions.
Introduction
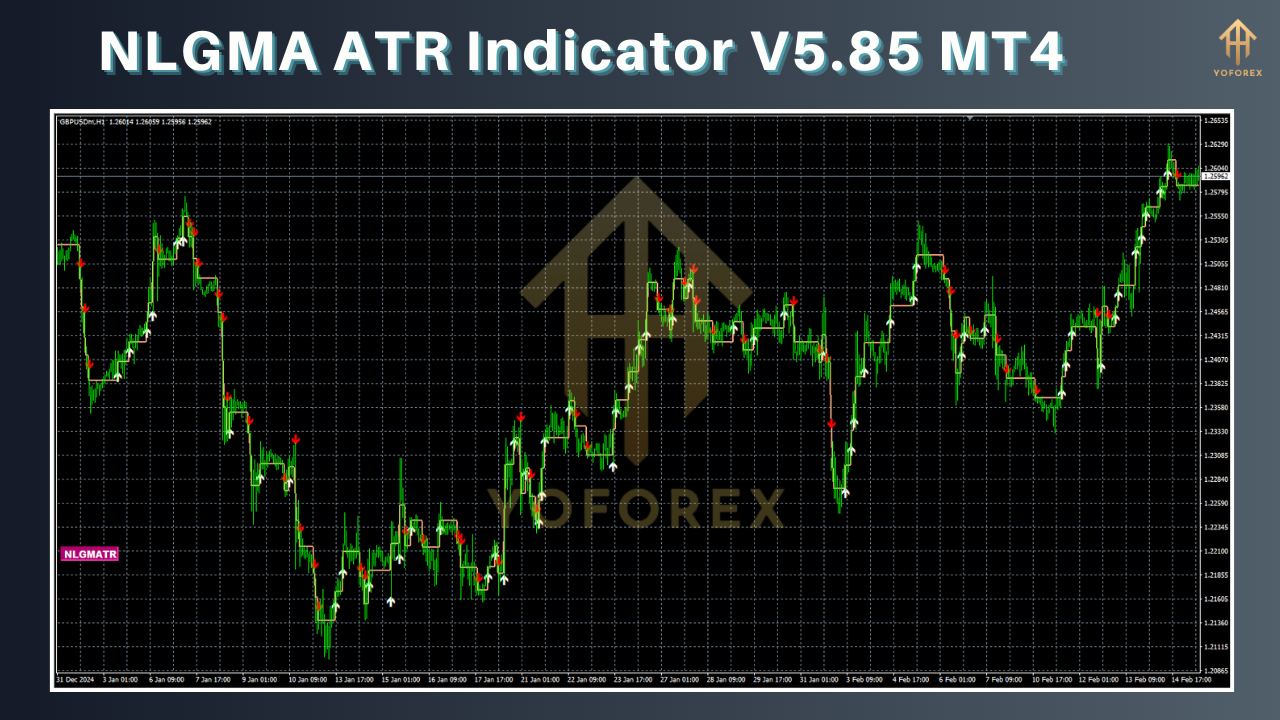
Volatility is at the heart of every trading strategy: too little and there’s no movement; too much and risk skyrockets. The Average True Range (ATR) indicator quantifies volatility by averaging the true range of price movements over a chosen period. The NLGMA ATR Indicator V5.85 MT4 builds on ATR’s core principles, adding visual enhancements and customizable alerts tailored for MetaTrader 4 traders.
What Is the Average True Range (ATR)?
The ATR is a technical analysis tool introduced by J. Welles Wilder Jr. in 1978 to measure market volatility. Unlike trend indicators, ATR does not signal direction—it reflects the degree of price fluctuation within each period MetaTrader 4.
True Range (TR) for each period is calculated as the greatest of:
- Current high minus current low
- Absolute value of current high minus previous close
- Absolute value of current low minus previous close.
The ATR is then a smoothed moving average—typically over 14 periods—of these TR values.
Overview of NLGMA ATR Indicator V5.85
NLGMA ATR Indicator V5.85 is a custom MQL4 implementation that extends the standard ATR by:
- Drawing dynamic ATR-based channels around price bars for clear volatility envelopes.
- Displaying a colored histogram highlighting ultra-low to ultra-high volatility zones, making it easier to spot volatility spikes at a glance.
- Providing built-in alerts (pop-ups, email, mobile push) when ATR breaks user-defined thresholds.
- Supporting multi-timeframe analysis, allowing ATR values from different charts to be overlaid in a single window.
- Offering sound notifications for crossovers with a moving average of ATR to flag trend transitions.
These enhancements transform ATR from a plain volatility gauge into a versatile trading assistant.
Key Features and Benefits
1. Dynamic ATR Channels
Instead of a single line, NLGMA ATR creates upper and lower channels at customizable multiples of the ATR value (e.g., 1×, 1.5×, 2×) Forex Factory. Traders can visually assess whether price is approaching extreme volatility bands, facilitating breakout or mean-reversion strategies.
2. Colored Volatility Zones
The histogram uses six default zones—ultra-low, low, average, high, very high, ultra-high—color-coded for quick recognition PipTick. This zone approach helps filter signals: high-volatility readings might suggest widening stops, while low readings hint at consolidation.
3. Configurable Alerts
Set alerts for ATR crossing above or below any channel line, or for crossing a moving average of ATR. Notifications can be delivered via email or mobile push, ensuring you never miss key volatility shifts.
4. Multi-Timeframe Support
Select additional timeframes (e.g., H4 ATR on an H1 chart) to spot divergences between short- and long-term volatility trends—an advanced tactic for anticipating regime changes.
5. Sound and Visual Signals
Customizable beep sounds and flashing chart objects make sure you notice even when away from the screen.
Installation and Setup
Download the Indicator
Obtain the
.mq4file from your licensed provider or the MQL5.software marketplace.
Place in Indicators Folder
Copy
NLGMA_ATR_V5.85.mq4into...\MetaTrader 4\MQL4\Indicators.
Compile in MetaEditor
Open MetaEditor, locate the file, and compile. Resolve any missing library references.
Attach to Chart
In MT4, open your chosen chart, drag NLGMA ATR Indicator V5.85 from the Navigator onto the chart.
Configure Inputs
Period (default 14)
Channel Multipliers (e.g., 1.0, 1.5, 2.0)
Histogram Zones (adjust color boundaries if desired)
Alert Conditions (ATR cross thresholds or MA cross)
Timeframes (primary and optional overlay).
Recommended Settings
While every trader’s style differs, the following settings serve as a starting point:
| Setting | Value | Purpose |
|---|---|---|
| ATR Period | 14 | Standard smoothing period |
| Channel Multipliers | 1, 1.5, 2 | Envelopes for breakout (1×) and extreme moves (2×) |
| Histogram Zones | Default | Color bands per volatility percentile |
| ATR MA Period | 50 | Trend transition filter |
| Timeframe Overlay | H4 on H1 | Spot divergence between long/short volatility |
Default values can be tuned based on instrument volatility and trading timeframe.
Timeframes and Instruments
The NLGMA ATR Indicator V5.85 excels on any instrument—forex, commodities, indices—but works best on timeframes H1 and above for reliable volatility readings. For scalpers, an M15 chart with a shorter ATR period (7–10) can capture quicker fluctuations. Pair it with instruments known for volatility, such as XAU/USD (gold) or GBP/JPY, to exploit dynamic ATR channels.
Trading Strategies
Breakout Confirmation
Use ATR channels:
- When price breaks above the upper 1.5× ATR channel, confirm with volume or RSI and enter a long breakout.
- Conversely, a break below the lower channel can signal a short opportunity.
Mean Reversion
In low-volatility zones (histogram in ultra-low/low bands), anticipate consolidation breakouts. Set orders just outside ATR channels with tight stops inside the bands.
Volatility-Based Stop Loss
Calculate your stop distance as 1× to 2× the current ATR value. For example, an ATR of 0.0027 (27 pips) suggests a 27–54 pip stop, adapting to ongoing volatility .
Position Sizing
Determine position size by dividing a fixed dollar risk by ATR value:
This self-adjusts exposure in high/low volatility environments.
Limitations and Considerations
- No Directional Signal: ATR measures strength, not trend. Always combine with a trend filter (e.g., MA or MACD).
- False Signals in Range: In sideways markets, ATR channels can whipsaw. Consider reducing sensitivity by using larger multipliers.
- Lagging Nature: As a moving average, ATR reacts to past volatility—fast spikes may not be captured immediately.
- Platform Reliance: Ensure MT4 build is updated; older builds may not support multi-timeframe overlays.
FAQs
How do I use the ATR indicator?
Apply ATR to measure volatility. Use a 14-period setting by default to gauge average price movement over 14 bars.
What is the best ATR period?
14 is standard for daily charts. Shorter periods (7–10) suit intraday trading; longer periods (20–50) smooth readings for weekly/monthly analysis.
Can ATR predict price direction?
No—ATR only quantifies volatility, not trend direction. Combine with trend-following tools for directional bias
Why is ATR useful for stops?
ATR-based stops adjust to market conditions, preventing premature exits in high-volatility phases and avoiding tight stops during quiet periods
Upgrade
For the latest V5.85 enhancements—including mobile notifications and optimized code—upgrade directly via your MQL5.software dashboard.


Comments
No comments yet. Be the first to comment!
Leave a Comment